Research Focuses on Creating Visualization Methods for Vector Field Data
“Living in the Age of Information, we are deluged by data,” said Guoning Chen, assistant professor of computer science at the University of Houston. “The useful information in this data is sparse and hidden. To mine this information, we have to devise efficient methods to process and interpret excessive amounts of data.”

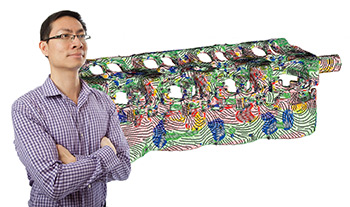
NSF CAREER Award recipient, Guoning Chen, with his visualization of coolant flowing
through a cooling jacket surrounding an engine.Chen, whose research focuses on creating methods to visualize large-scale scientific
data, is devising such methods.
Chen, who joined the College of Natural Sciences and Mathematics in 2012, was awarded a prestigious National Science Foundation CAREER Award. This five-year award, for $499,053, covers his research, a portion of which will be integrated into his teaching.
NSF CAREER grants are awarded to promising junior faculty who exemplify the role of teacher-scholars through “outstanding research, excellent education and the integration of education and research.”
Visualization Offers an Efficient Method to Interpret Data
Collecting large amounts of data is a common practice these days for researchers working on various scientific and engineering problems. The major hurdle is making sense of these data. One problem is speed: can large amounts of data be processed quickly? A second problem is fidelity: can this data be represented in a way that is both accurate and informative?
“The visual channel is the most effective way for a human being to receive information,” Chen said. “People can easily perceive patterns and trends from the visual representation of the data. This is why the field of visualization is so important.”
The visualization methods Chen is creating can be applied to a diverse array of fields as a way of understanding and interpreting large-scale vector-valued data. Areas that can benefit from these methods include climate study, physics, chemistry, mechanical and civil engineering, oceanography, earthquake engineering, and cardiovascular disease diagnosis.
Accurate and Effective Visual Representations Help Experts Understand Results
“I want to create accurate representations to serve as an intermediary between the raw data and the experts who can interpret the data more efficiently, so that they won’t be drowning in a flood of data,” Chen said. “For this, it needs to be intuitive and informative, without losing any of the important information.”
Chen’s research focuses on devising methods to create visual representations of vector fields so that experts can understand their experimental results and validate their simulation models. In this project, he will be working with data provided by collaborators from mechanical engineering and oceanography.
“One of the reasons this big data problem is so overwhelming is because of the inherent complex behaviors of vector fields that are further complicated with the increase of the dimension,” Chen said. “I am proposing a more effective and practical solution via a hybrid link-graph representation.”
Metrics for Assessing Fidelity of Visual Representations
Chen will also be devising methods to assess the fidelity and accuracy of the visual representations of vector fields.
“Currently, we have no way to measure the physical authenticity and fidelity of the visualization techniques that are on the market,” Chen said. “Without knowing this, experts will not use these techniques. Part of my research will be developing the metrics to quantify this.”
Components of this research will be used to enhance Chen’s teaching.
“Many of the students in my introductory programming course don’t understand the real-world applications of these programming skills,” Chen said. “I am planning to integrate a component from my research as a project for this undergraduate course.”
- Rachel Fairbank, College of Natural Sciences and Mathematics